
This week I wanted to take the data I’d already been sitting with — country-level YouTube usage, mostly — and actually see what happens when you run the same kind of information through three different map styles in DataWrapper. It’s easy to default to whatever chart type looks familiar, so I figured the more honest test was to build a choropleth, a symbol map, and a locator map and see which one actually earned its place.
Choropleth: YouTube Users by Country 2026
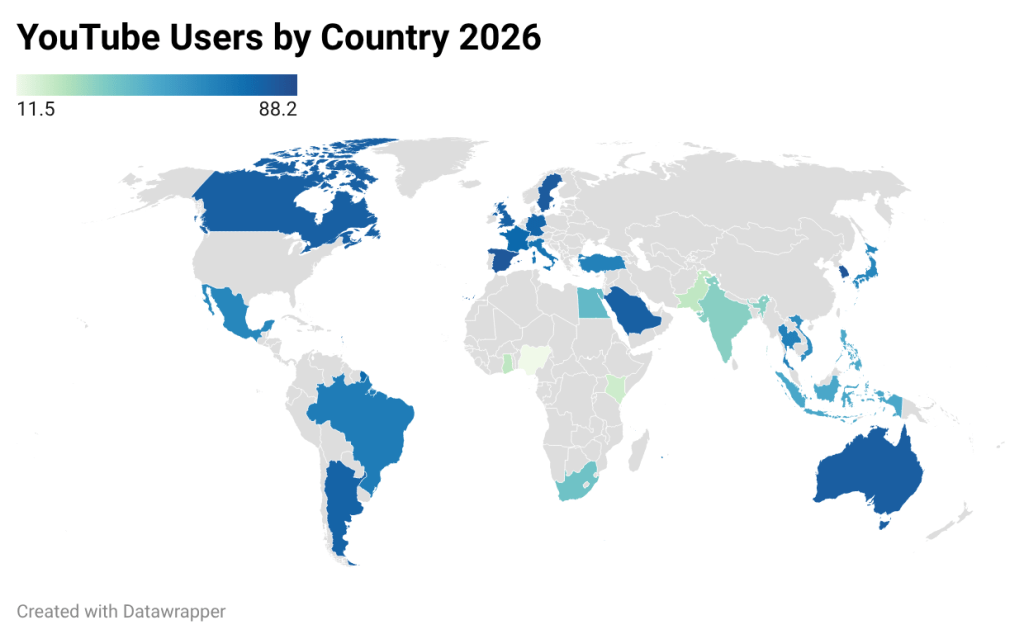
This one reuses the country-level YouTube data from last week — the share of each country’s population using YouTube, shaded from light green to dark blue. A choropleth is the obvious choice when the whole point is comparing rates across a lot of regions at once; you can scan the map and immediately see where reach is highest (Australia, Canada, Scandinavia, most of Western Europe) versus lowest (Nigeria, Kenya, India) without reading a single number. Where it falls short: it can’t show raw scale at all — India shows up pale green here because its penetration rate is comparatively low, but it’s still one of the largest raw YouTube user bases on earth. A choropleth alone would let you walk away with the wrong impression if you didn’t already know that.
Symbol map: Vtuber Agencies by Country
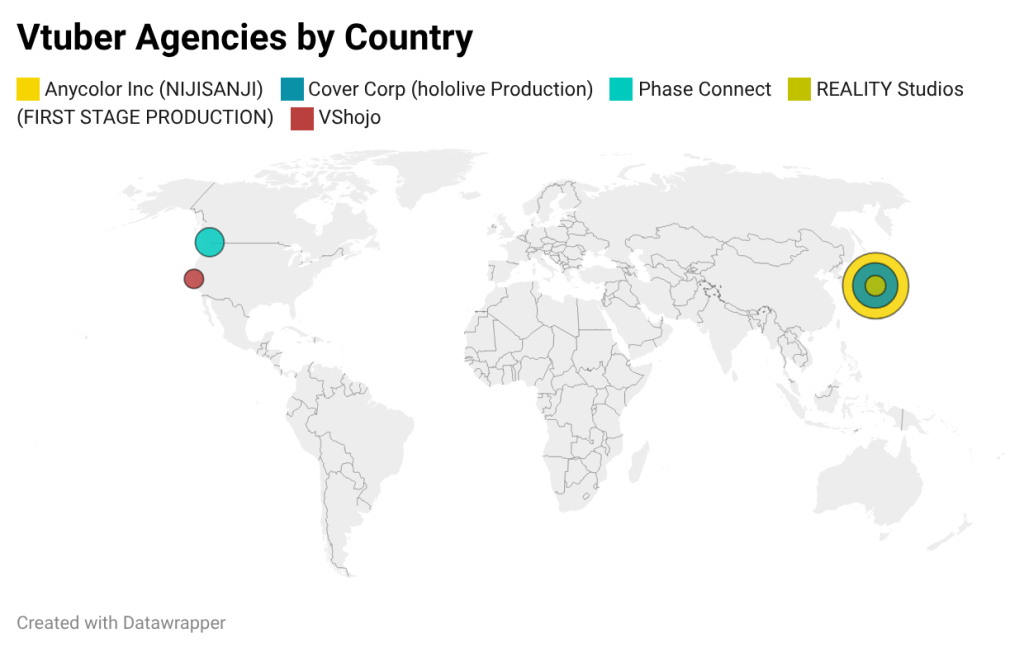
For the data that needed to be built from scratch, I mapped the headquarters of the agencies behind a lot of what I actually watch — Cover Corp (hololive), Anycolor (NIJISANJI), REALITY Studios (FIRST STAGE PRODUCTION), VShojo, and Phase Connect — with each circle sized by how many talents the agency manages. This is where a symbol map earns its keep over a choropleth: I don’t want to shade entire countries, I want to point at specific places and show relative size. The map ends up making a point almost by accident — three of the five agencies stack up as nested circles in almost the exact same spot in Japan, because they’re all headquartered within a few miles of each other in Tokyo, while VShojo and Phase Connect sit alone out in North America. It’s a good visual for something I hadn’t really thought about before: how concentrated this industry actually is, geographically, even though its fanbase is completely global.
Locator map: Conventions for Vtubers
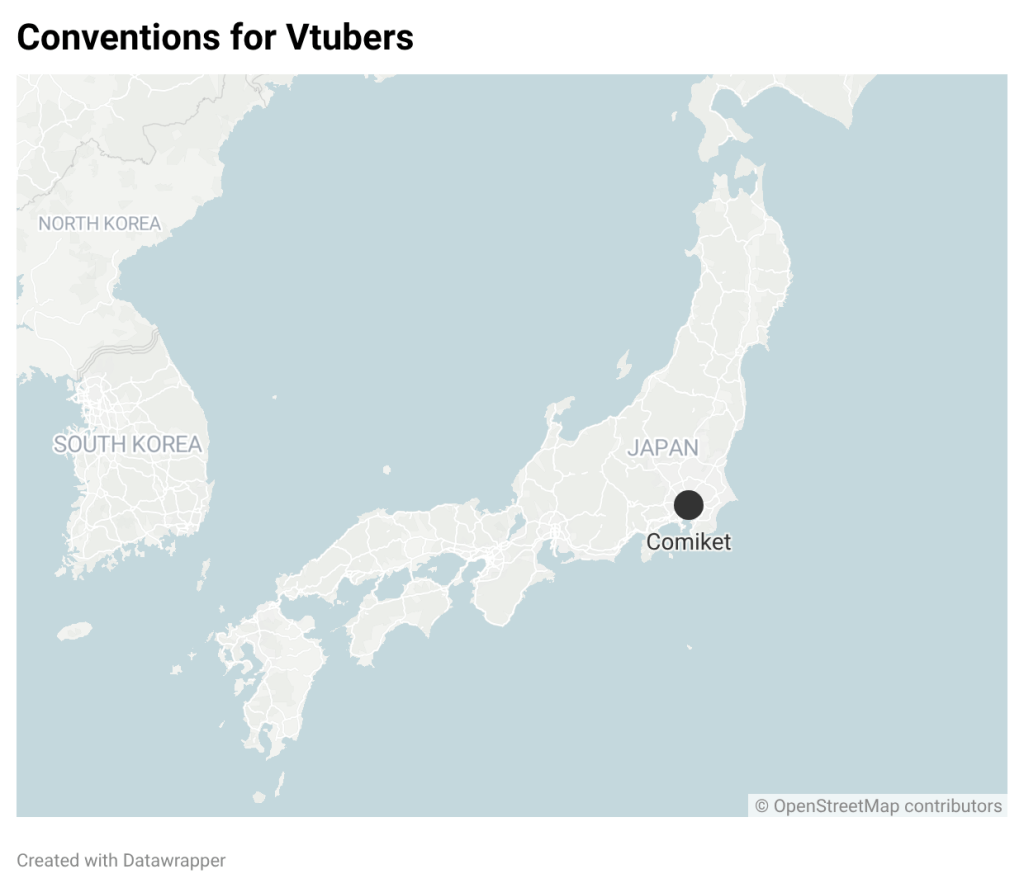

The last one is the simplest by design — just labeled pins on real venues: Comiket in Tokyo, and OffKai Expo, Anime Expo, and TwitchCon San Diego all clustered on the US West Coast. No color scale, no size variable, nothing to compare numerically — just orientation. I ended up splitting this into two regional screenshots instead of one global view, because zoomed all the way out, Comiket and the three California/Nevada-area events collapsed into an unreadable cluster of overlapping labels. That was actually a useful mistake: a locator map is supposed to make places easy to find, and if the zoom level defeats that, the map has stopped doing its one job.
What the experiment actually taught me
Running the same general subject through three map types back to back made the differences a lot more concrete than reading about them ever did. The choropleth is for rates across regions (but it can flatten out raw scale), the symbol map is for specific points with a size dimension (and it’s genuinely good at surfacing clustering you didn’t expect, like three companies practically on top of each other), and the locator map is for pure orientation — which only works if the points aren’t so close together that the zoom level erases the whole point of using a locator map in the first place. Picking the wrong one wouldn’t just look worse, it would actively mislead: a choropleth of the agency headquarters would smear five specific companies into whole shaded countries, and a symbol map of the YouTube penetration data would lose the region-wide comparison that makes it useful.
Sources: YouTube penetration data from World Population Review; VTuber agency and talent-count figures compiled from the Virtual YouTuber Wiki, VTuber NewsDrop, and Wikipedia; convention venues and dates from OffKai Expo and TwitchCon. Charts built in DataWrapper.


Leave a Reply