
I’ve watched a lot of YouTube this past month. That’s not a confession — it’s a data set. So I decided to actually track it: every session, every category, every hour of the day, cross-referenced against how much schoolwork I had going on at the same time. I wanted to know if my viewing habits were as “mindless” as I assumed, or if there was a pattern underneath them I’d never noticed.
What I found reframed the whole question. This isn’t really a story about how much I watch. It’s a story about when I watch, why I watch, and what that timing reveals about stress, autonomy, and habit.
Panel 1 — How I Actually Spend My YouTube Time

Before zooming into anything specific, I wanted the whole picture: where does the time actually go? Broken down by category over about a month, gaming (30 hours) and VTuber content (25 hours) immediately pull ahead of commentary/reaction (12 hours) and music (6.5 hours) — together they account for nearly three-quarters of everything I watched.
That split isn’t surprising on its own. What it does is set the terms for the rest of the story: if two categories are carrying most of the weight, the next natural questions are when that time gets spent, and how deliberately.
Panel 2 — When Am I Actually Watching?

Total hours only tells you what I watch — not when. Breaking the same viewing down by time of day shows it clustering heavily in the evening and late-night hours: Evening (4pm-8pm) and Late Night (12am-4am) alone account for 46 of my 73.5 total hours — nearly two-thirds of everything, in just two of six time blocks.
That clustering matters for what comes later. If viewing concentrates in specific windows rather than spreading evenly across the day, it starts to look less like background noise and more like a scheduled decompression period — which is exactly the idea Panel 4 tests.
Panel 3 — Subscribed vs. Recommended
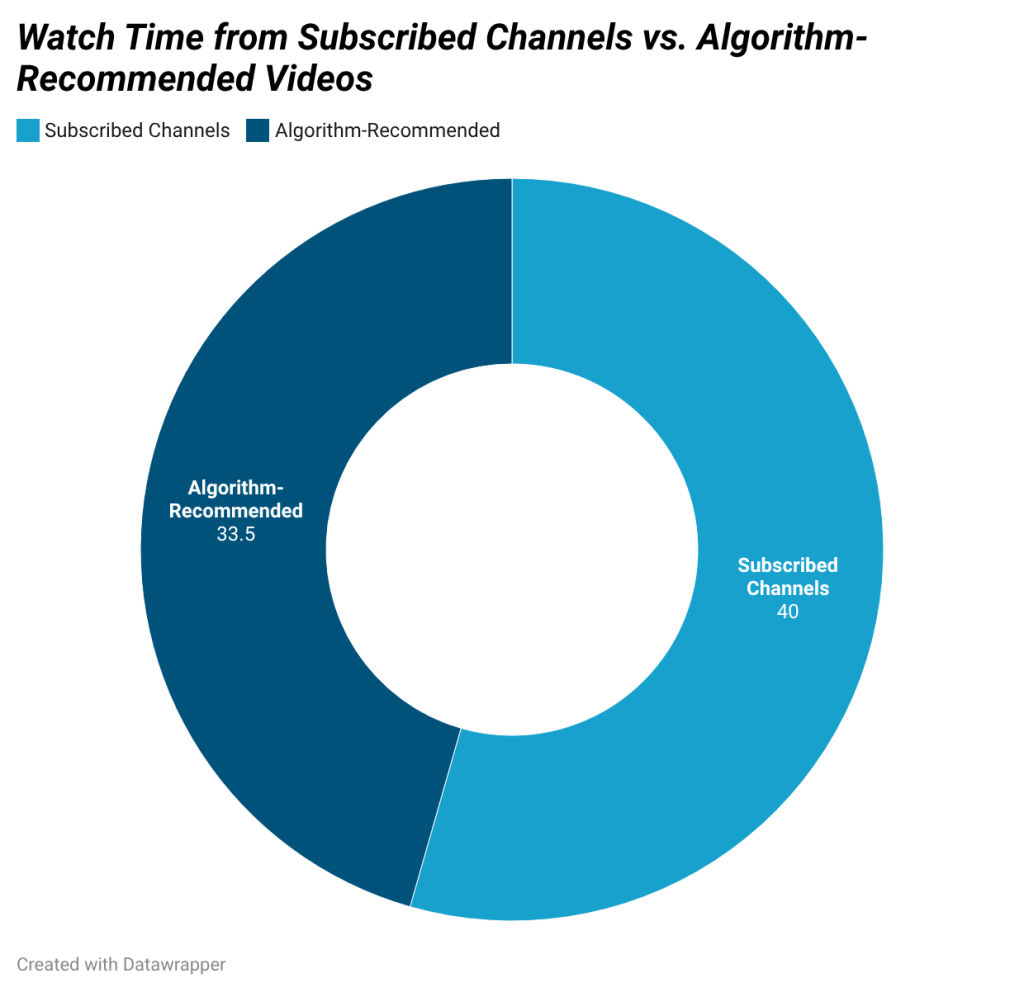
Here’s where I genuinely didn’t know the answer going in. Of all the time logged, 40 hours (54%) came from channels I actively subscribe to, and 33.5 hours (46%) came from videos the algorithm surfaced for me.
That’s closer to a coin flip than I expected. It turns out my viewing is a little more self-directed than the “algorithm rabbit hole” stereotype suggests — but not by much. Nearly half of what I watch is still something I never went looking for. That near-even split becomes the thread Panel 7 picks back up at the very end.
Panel 4 — Watch Time vs. Academic Workload

The common assumption is that screen time rises when there’s nothing else to do — that it fills free time. So I plotted weekly watch hours against a rough measure of my school workload over the same six weeks of the fall semester, right as school pressure started ramping up.
It doesn’t hold up. The two lines move together, not apart — watch time climbs from 8.5 hours in Week 1 to 19.5 hours in Week 6, tracking almost exactly alongside my rising workload score. Instead of watch time filling the gaps in a light week, it’s showing up heaviest in the weeks I had the least time to spare. That’s the pivot point of the whole story: this isn’t a story about free time. It’s starting to look like a story about stress.
Panel 5 — How Long Are My Viewing Sessions?
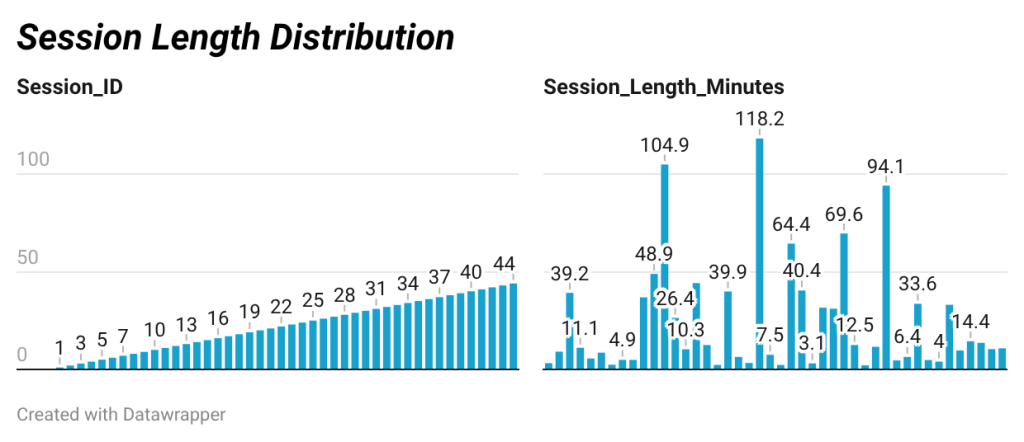
If watch time really is tracking stress rather than boredom, session length should say something too. Short clips suggest quick, distracted breaks; long sittings suggest something closer to deliberate escape or decompression.
The distribution is heavily right-skewed: about 64% of my logged sessions ran under 15 minutes, but the same stretch also includes a handful of outliers past the hour mark — one session ran 94 minutes, another almost two full hours. That distinction matters because raw hours don’t distinguish between “I watched five 3-minute clips between assignments” and “I sat down for two hours.” The short sessions read like fragmented coping squeezed between obligations; the rare long ones read like an intentional, if occasional, full escape.
Panel 6 — The Big Takeaway: Viewing Spikes Under Stress

This is the panel the whole story has been building toward. One week stands out well above the trend line — watch time jumps to 19.5 hours, compared to a typical week averaging around 10.8 hours across the rest of the semester. That’s not a random spike. That week lines up exactly with finals.
Put together with Panel 4, this is the real finding: my YouTube time isn’t filling empty hours, it’s absorbing stressed ones. The instinct to treat screen time as “wasted time” doesn’t hold up against the data — it reads much more like a coping mechanism than a lack of better options.
Panel 7 — Is My Viewing Intentional or Incidental?
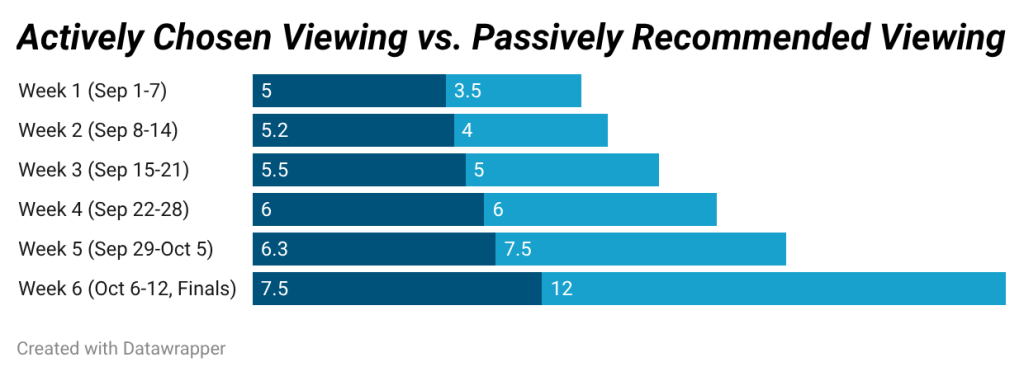
So where does that leave the autonomy question from Panel 3? Closing the loop, across the full six weeks 48% of my viewing was something I actively sought out, and 52% was passively recommended to me — almost the same near-even split as Panel 3, just tilted slightly the other way.
The more telling number is what happens during finals week specifically: active viewing barely moves (7.5 hours, about the same as every other week), while passive viewing nearly doubles to 12 hours. The extra hours under stress aren’t coming from things I chose — they’re coming from whatever autoplay serves up next.
That’s the note I want to end on, because it’s the one thing in this whole story I actually have some control over. The stress-driven spike in Panel 6 isn’t something I can fully engineer away — school workload is what it is. But how much of that downtime is a deliberate choice versus an algorithm’s suggestion is something I can shift, if I decide the current ratio isn’t the one I want. That’s less a conclusion than an open question I’m planning to keep tracking.


Leave a Reply